Graphic for Investment In StartUps
30 / July / 15 By Corey Ghilarducci
Back
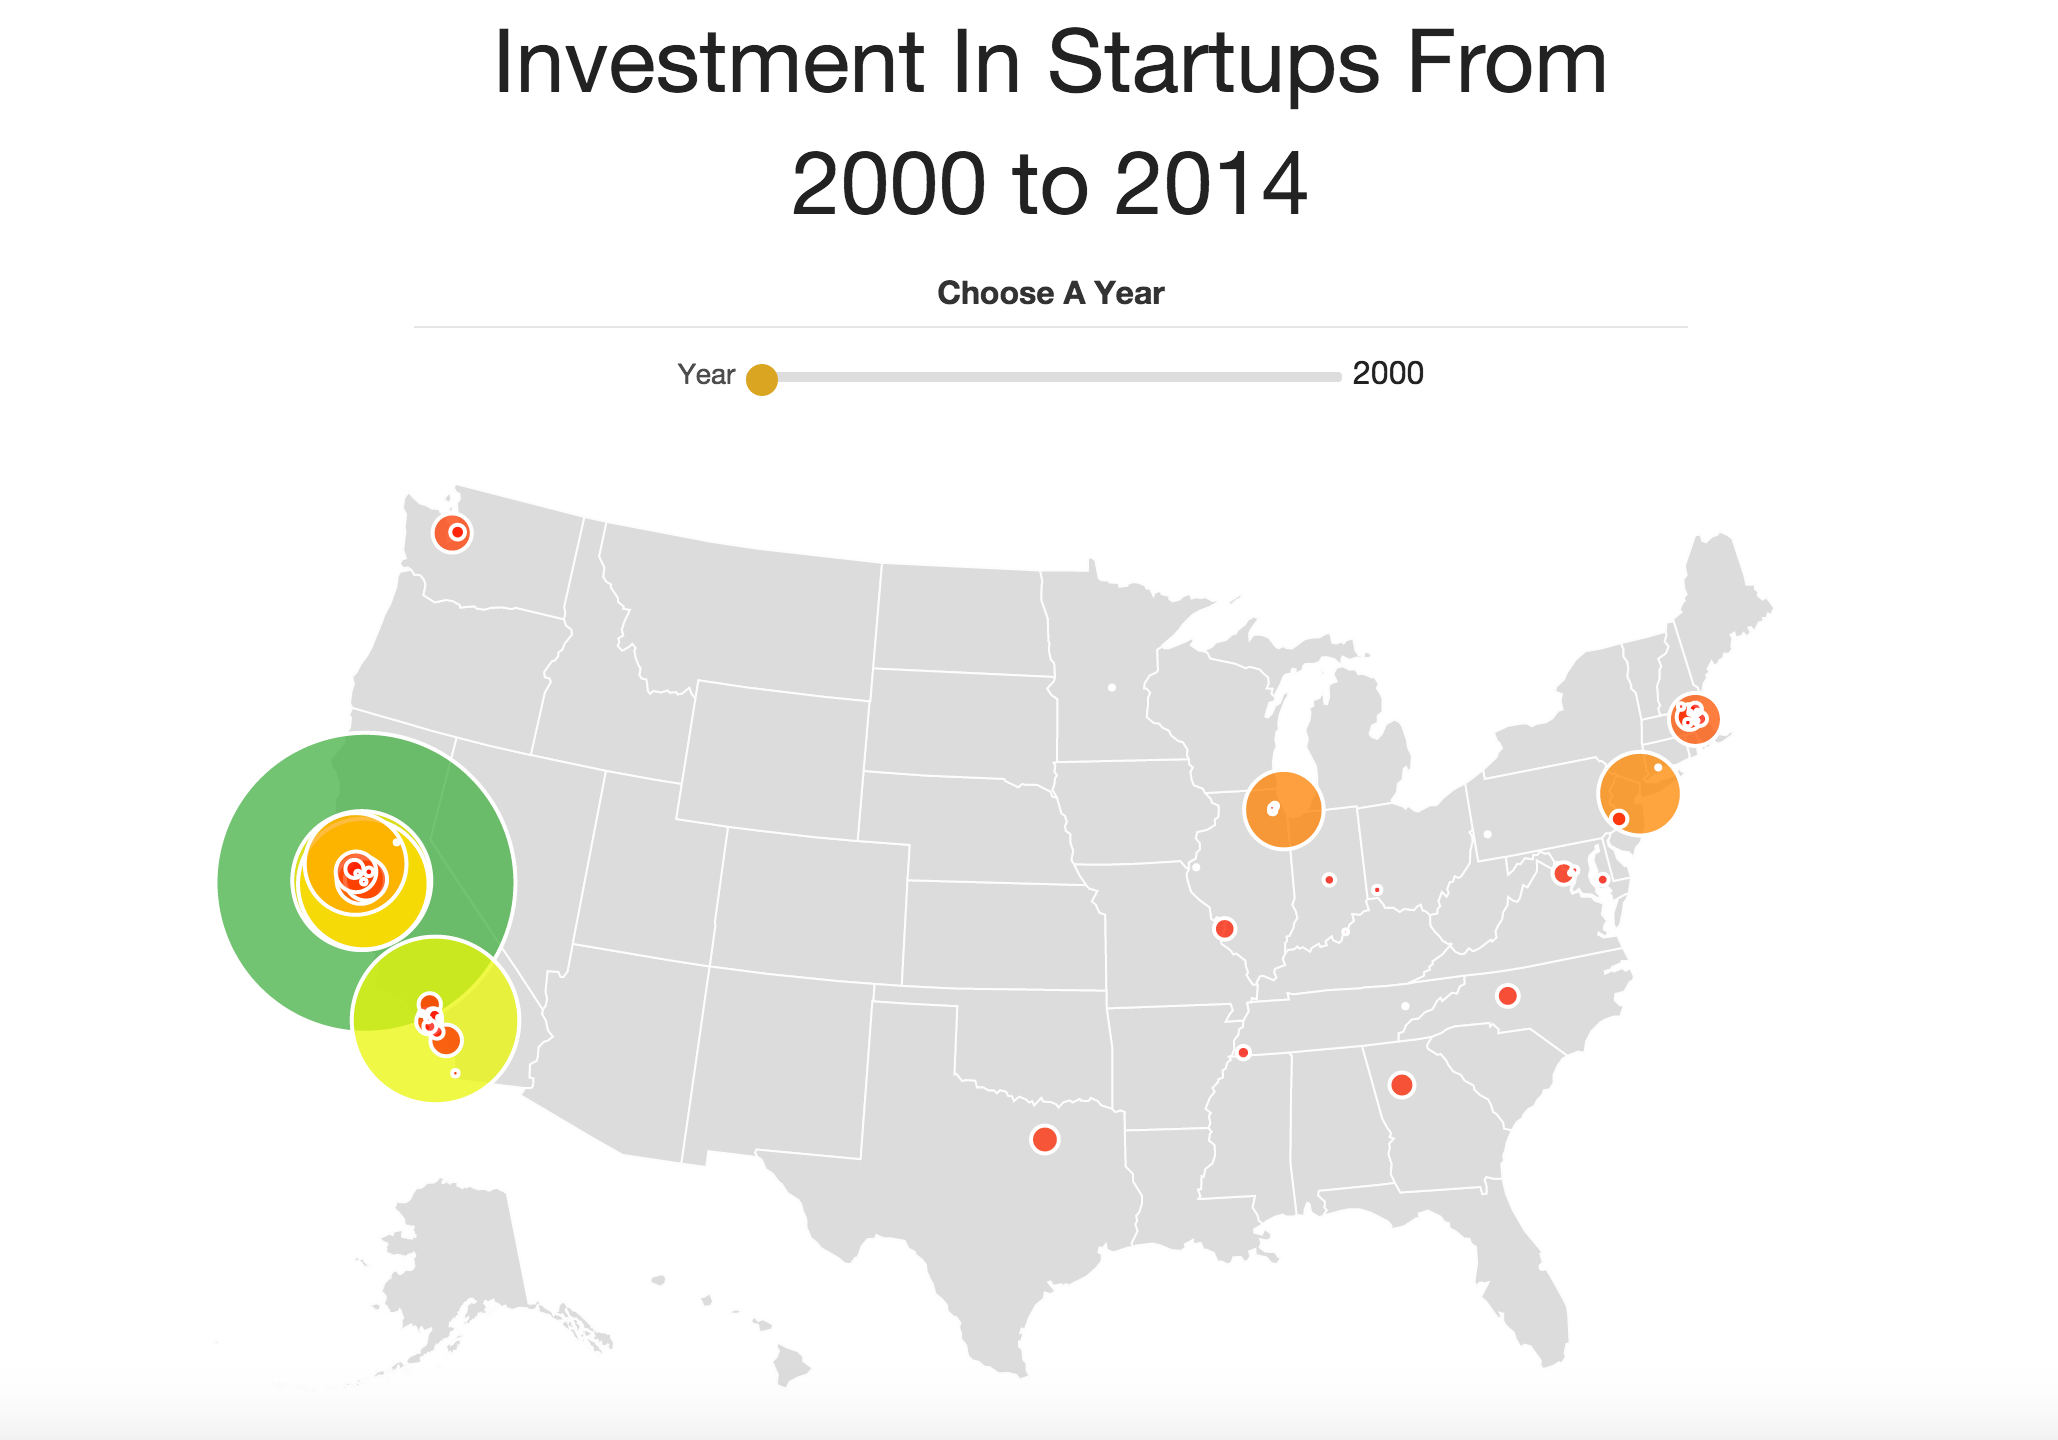
This data graphic shows the investments in startup from 2000 to 2014. Primary technologies used for the app is Rails, D3js, JQuery (for the AJAX), PostgreSQL and google's geocoder API.
Go to the website